Benchmarks are the yardsticks you use to judge your portfolio's performance. Without one, a 10% return is just a number — with one, you can tell whether you actually beat the market, kept pace with it, or trailed behind.
In Capitally, a benchmark is anything that has a price series over time: a market index (S&P 500, MSCI World), an ETF or stock, a custom price series you imported, or even your own portfolio positions. You can add several benchmarks at once and see them all alongside your returns on the charts and in the table.
Adding a benchmark
Open the benchmarks selector from the Portfolio view and pick anything that has a price series:
- Market indexes like the S&P 500, MSCI World, Nasdaq 100, or DAX
- ETFs or individual stocks — just search for a ticker and add it
- Custom assets you created yourself, including any black-box investment with a manually tracked price
- Filters, Accounts and Account Folders
- Economic indicators — real-world economic data like inflation (CPI, HICP), house prices (HPI), bond yields, and central bank rates, sourced from Eurostat, the OECD, and the World Bank. See Economic indicators below
- Your own positions — see Position-prices benchmark below
Once added, the benchmark appears on rate of return charts.
Comparing against multiple benchmarks
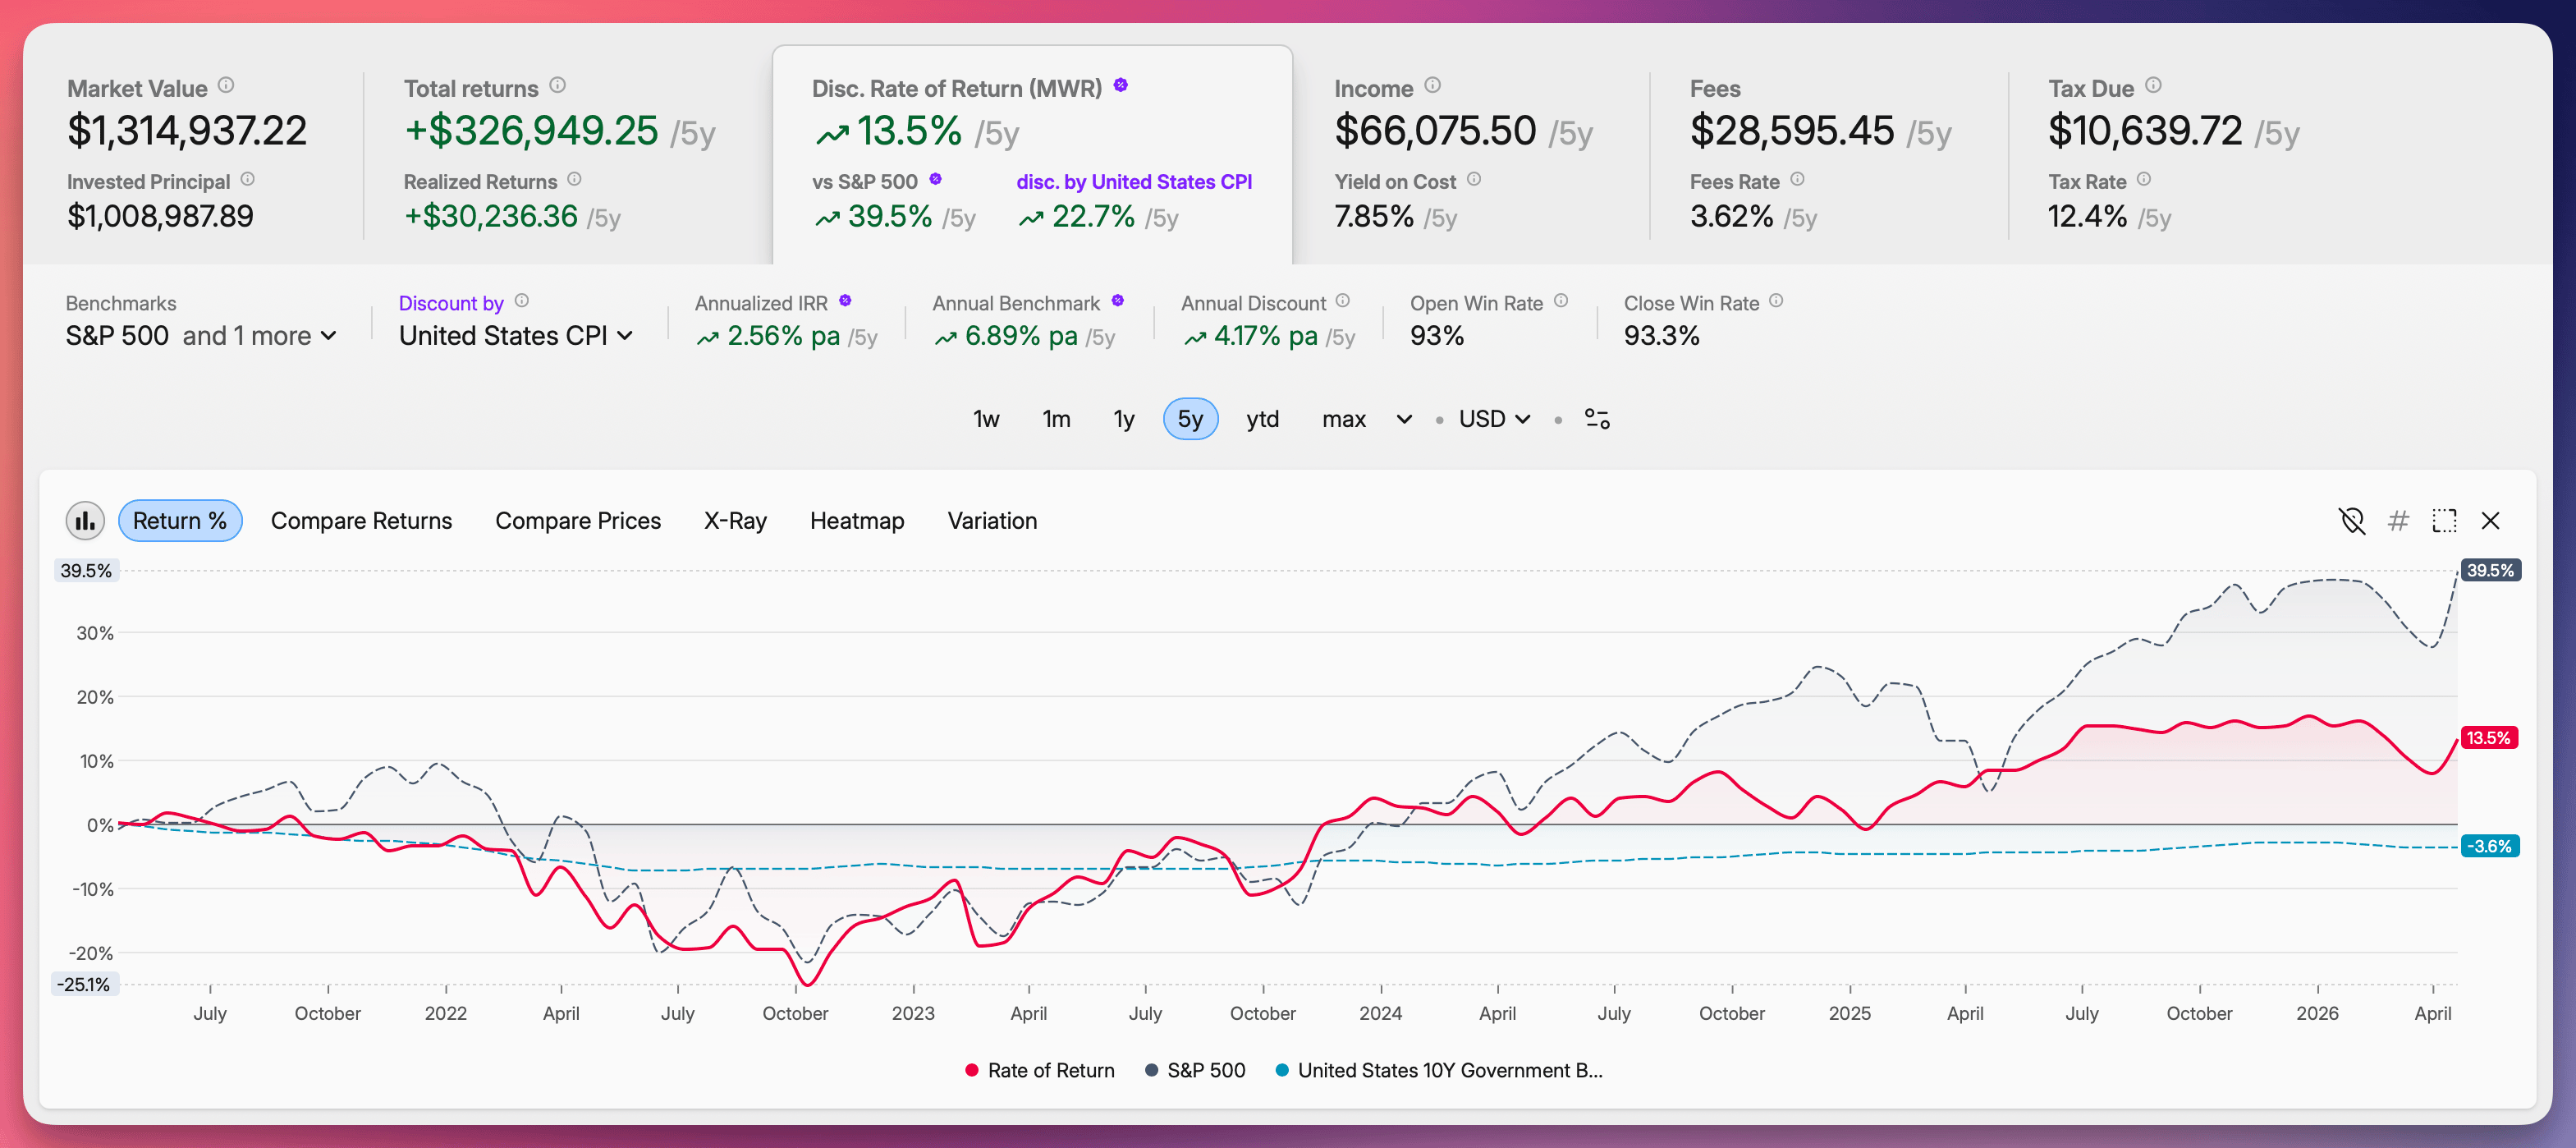
You're not limited to picking one. Select up to 10 benchmarks at the same time and Capitally will draw them all on the same chart. This is useful when a single index doesn't tell the full story — for example, comparing a global portfolio against both the S&P 500 and MSCI World, or stacking a sector ETF next to a broad market index to see which one you're actually tracking.
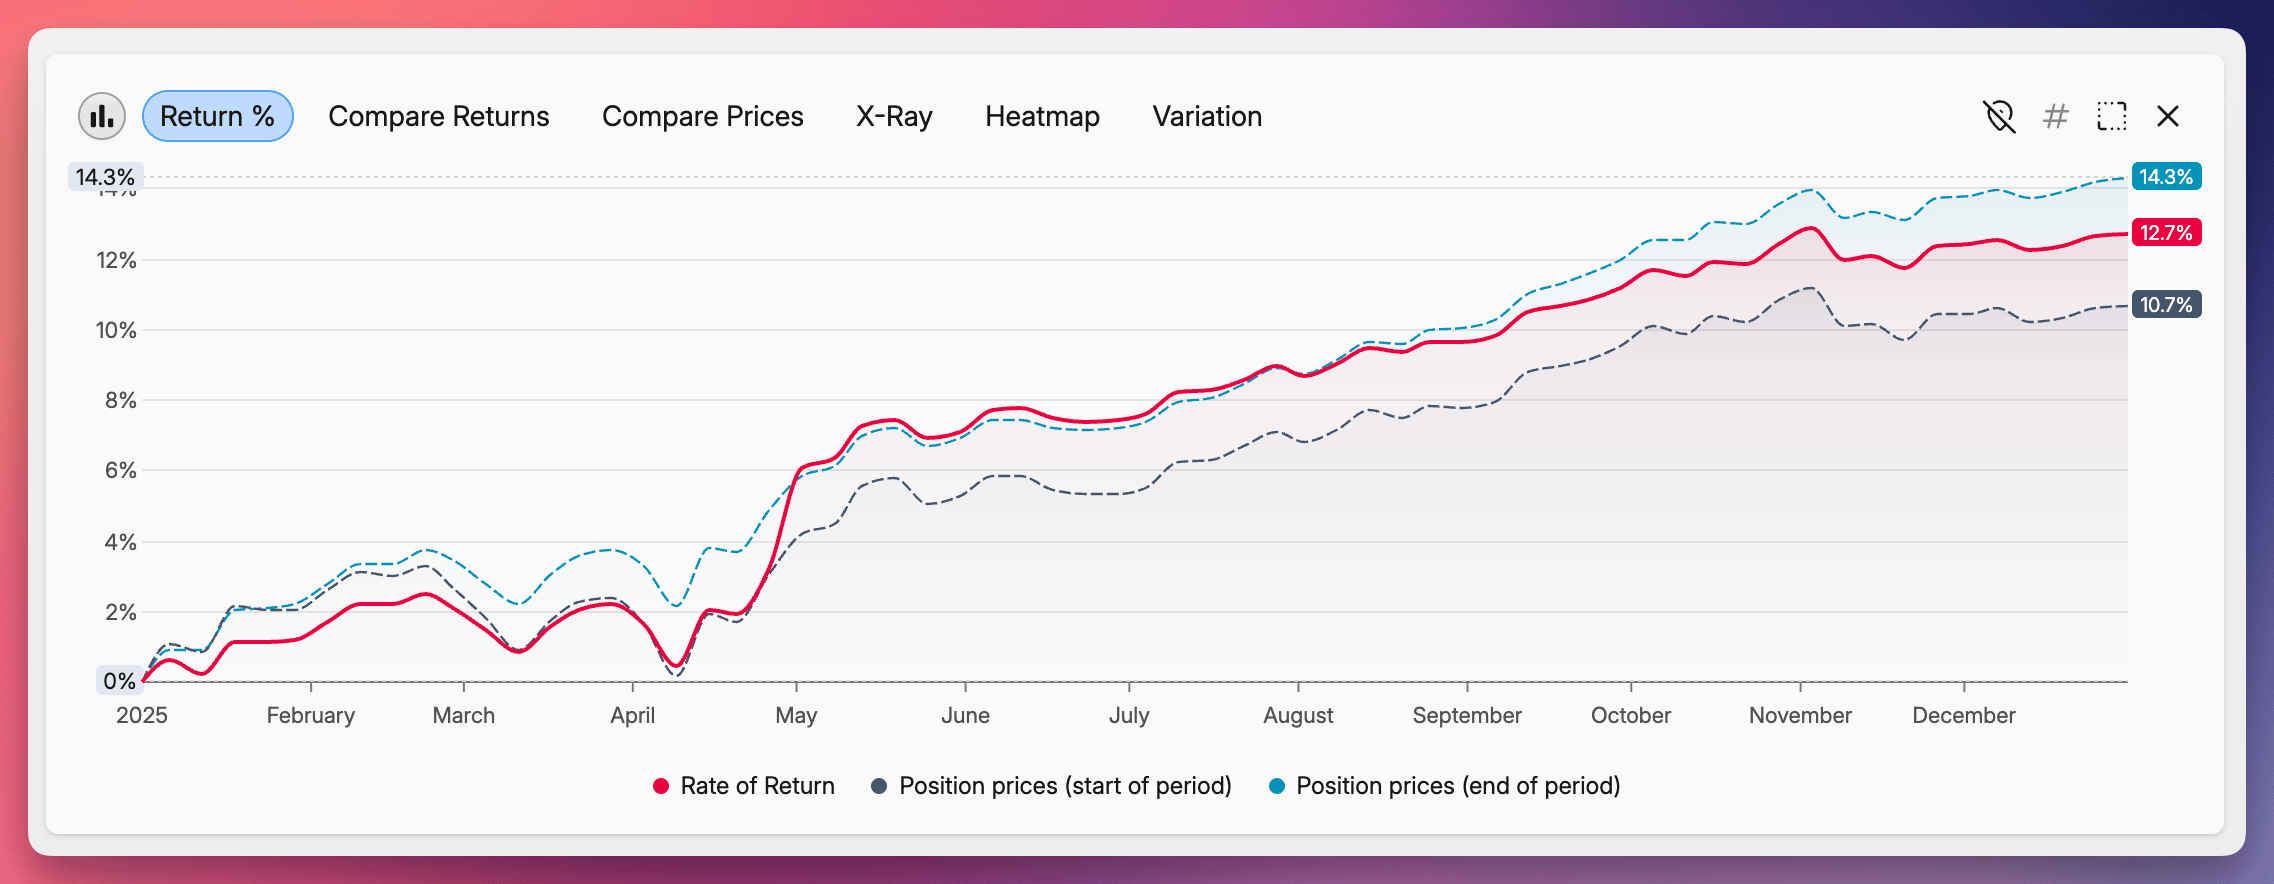
Position-prices benchmark
The position-prices benchmark answers a different question: what would my return have been if I hadn't traded at all during this period?
Instead of comparing you to an external index, Capitally builds a hypothetical version of your own portfolio that holds a fixed allocation through the whole period — no buys, no sells. The difference between your actual return and that hypothetical return isolates the effect of your trading activity.
You can choose which allocation to hold constant:
- Position prices (start of period) — keeps the allocation you actually had at the start of the selected period. Answers "what if I'd done nothing since the start?".
- Position prices (end of period) — projects the allocation you ended the period with back to the beginning. Answers "what if I'd held today's mix the whole time?" for a closed period.
- Position prices (today) — uses your current allocation. Answers "what if I'd always held what I hold now?".
Example
Open 2025 with the start of period option. You'll see the return of a portfolio that, on January 1st 2025, held exactly what you held, and didn't touch it for the rest of the year. If your actual 2025 return is higher, your trades added value. If it's lower, you'd have been better off doing nothing.
Economic indicators
Beyond stock indexes and ETFs, you can benchmark your portfolio against real-world economic data. Capitally provides a library of macroeconomic indicators for 60+ countries, sourced directly from Eurostat, the OECD, and the World Bank. Use them to answer questions a market index can't:
- Am I keeping up with inflation? Add US CPI or Poland CPI next to your portfolio and check whether your return line sits above or below it.
- How does my real-estate portfolio compare to the overall housing market? Germany HPI or UK HPI show the average movement of home prices in that country — a natural yardstick for any property you hold there.
- Is cash still a reasonable choice? US 10Y Government Bond Yield or Eurozone Central Bank Rate show what a near-risk-free return would have looked like over the same period.
- How is the broader economy doing? France GDP or Japan GDP give you a long-term macro reference to compare against.
Available indicators:
- CPI — Consumer Price Index (national)
- HICP — Harmonised Index of Consumer Prices (EU-wide methodology)
- HPI — House Price Index
- CBRATE — Central Bank policy rate
- GB3M / GB10Y — 3-month and 10-year government bond yields
- GDP — GDP growth
Search for them in the benchmark picker by country name (e.g. "Germany stats") or indicator name (e.g. "DE-CPI").
Nominal comparison
Economic indicators are shown as benchmarks against your nominal portfolio return. The comparison is side-by-side: if your portfolio line sits above CPI, you're growing in real terms; if it sits below, you're losing purchasing power. For a single combined number — your return minus the indicator — use Discounting by a benchmark instead.
Discounting by a benchmark
Side-by-side isn't the only way to use a benchmark. With Discount by, Capitally subtracts the benchmark's rate of return from your portfolio's rate of return — what's left is your real return (after inflation) or excess return (after the market).
Open the Rate of Return tab in Portfolio and pick a benchmark from the Discount by selector, right next to the regular benchmark picker. Recently used benchmarks, the predefined CPI/HICP list, and your own project benchmarks all appear there.
Some examples of when each one is useful:
- Discount by US CPI or Poland HICP — your real return after inflation. A 7% nominal return with 3% CPI shows up as ~4%.
- Discount by S&P 500 or MSCI World — your alpha vs the market.
- Discount by Germany HPI or UK HPI — how your real-estate holdings performed against the local housing market.
- Discount by US 10Y Government Bond Yield — your premium over a near-risk-free rate.
The discount applies to every rate-of-return method — TWR, IRR, and ROI alike. For a fair, apples-to-apples comparison, the benchmarks and individual asset price returns you're comparing against get discounted by the same series too — so everything on the chart is in the same units.
How benchmarks are calculated
Benchmarks use the same rate of return methodology as your portfolio, so the comparison is apples-to-apples. Values are converted into your selected viewing currency using daily FX rates.
Tips
- Pin your favorite benchmarks in Settings -> Benchmarks so they're always visible when you switch between views.
- Combine an external benchmark (e.g. S&P 500) with the position-prices (start of period) benchmark to see two very different comparisons side by side: "did I beat the market?" and "did I beat just holding still?".
- Use the Discount by selector to convert any benchmark from a side-by-side comparison into a baseline that gets subtracted from your return — useful for showing real (after-inflation) or excess (after-market) return as a single number.